> ## Documentation Index
> Fetch the complete documentation index at: https://docs.coverbase.com/llms.txt
> Use this file to discover all available pages before exploring further.
# Financial health guide
> How to read a vendor's Financial Health Score, what the confidence tier tells you, and how private companies with no filings are scored.
For AI agents: a documentation index is available at [https://docs.coverbase.com/llms.txt](https://docs.coverbase.com/llms.txt). This page is also available in markdown by appending .md to the URL.
This guide is part of the [User Guides](/user-guides/overview) collection. For what the capability is and where it stops, see [Financial Health Score](/products/financial-health-score).
This page scores how likely a vendor is to still be trading, and to still be investing in the product you depend on. It is built from filings, funding, corporate standing and public signals, without asking the vendor anything.
## Finding it
Open a vendor, go to **Vendor Intelligence**, and pick the **Financial health** tab.
 ## The summary at the top
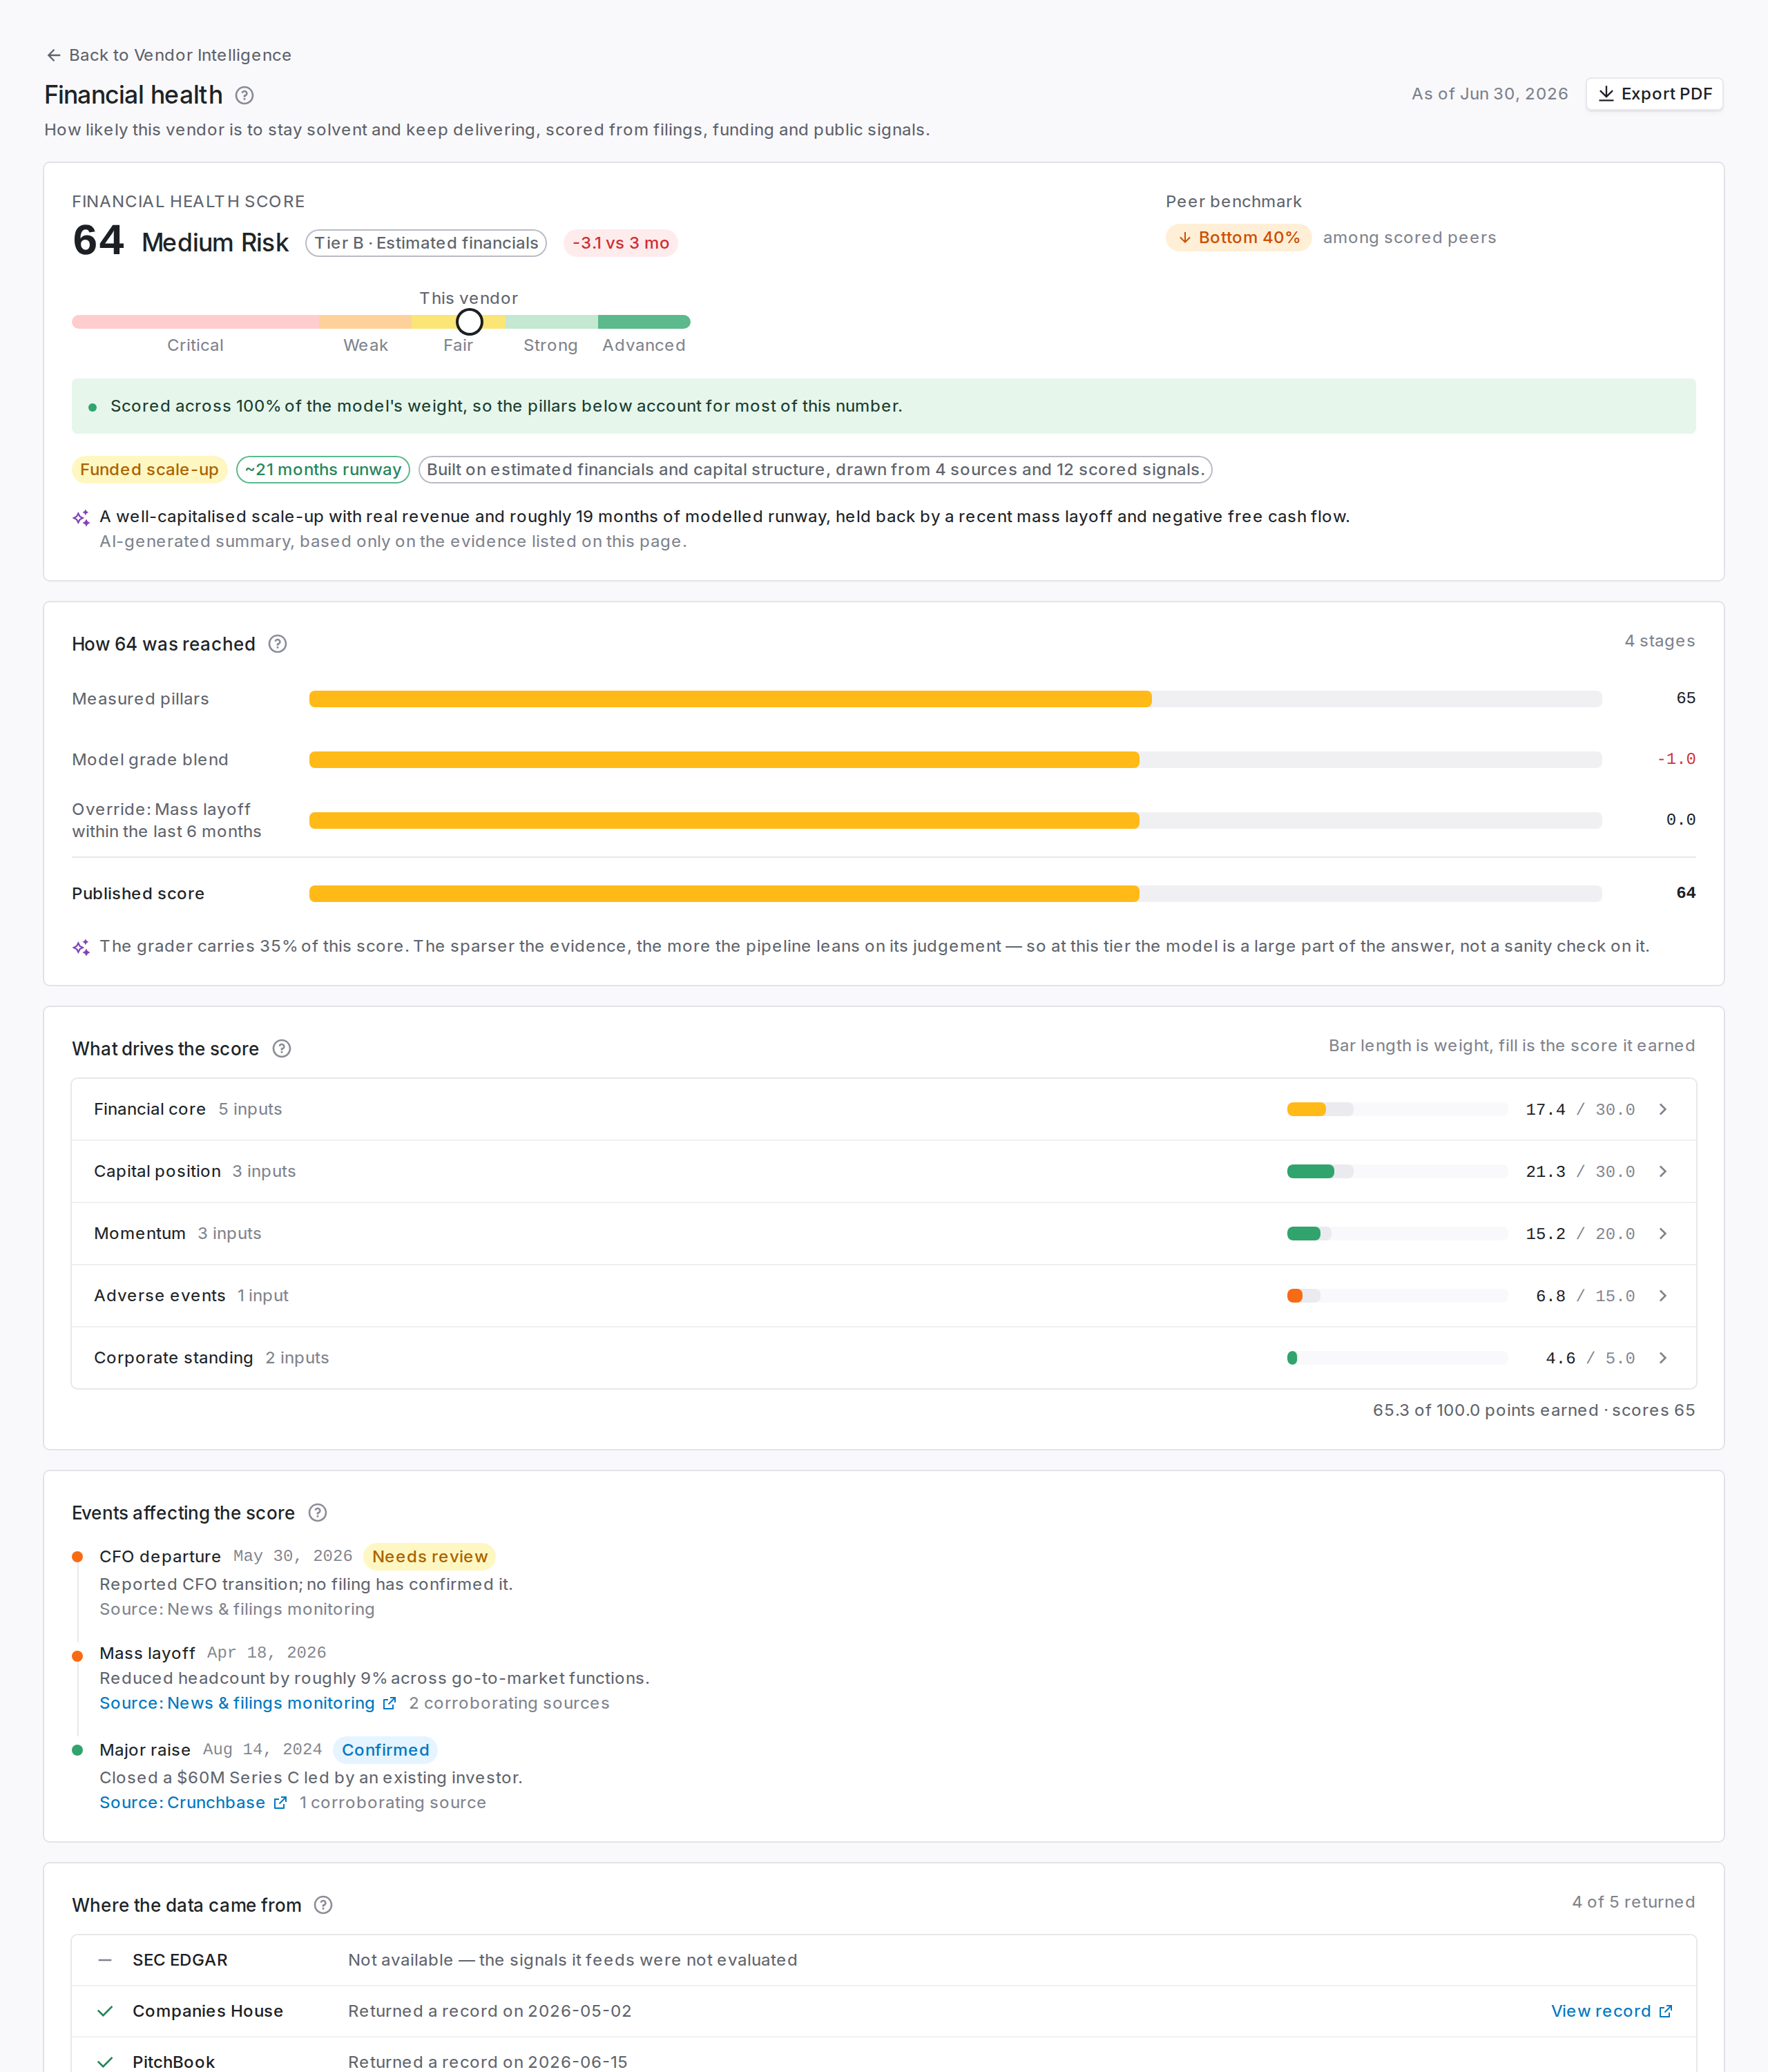
Before the pillars, the page answers three questions in one or two lines: what the score was built on, how much that evidence is worth, and how stable the company is.
The first line comes from the scorecard itself: the evidence basis, how many sources and signals went in, the stability class, and the runway verdict. Where a model summary is available, a second line adds a plain-language read of this specific vendor. It is marked as AI-generated and is written only from the evidence listed further down the page.
On a vendor you have never looked at, the summary is usually enough on its own.
## The tier tells you what the number is worth
A 72 backed by audited filings and a 72 inferred from funding rounds and headcount signals are not the same claim. The confidence tier tells you which you are looking at. Mention it whenever a score surprises you.
Tier reflects what data was available, not how the vendor is doing. A private company with no filing obligation lands in a lower tier because of its jurisdiction and structure, not because anything is wrong.
Scores used to be comparable only within a tier. They are now held to a common scale across tiers by the stability class below, so ranking a portfolio on the raw number is reasonable. The tier still tells you how much evidence stands behind any individual result.
## How stable is this company
Companies do not all survive the same way, so one number cannot order them unless something says what kind of company each one is. The **stability class** does that, from what can be observed: scale, operating history, whether the business generates cash, and how dependent it is on outside capital. Never from a name or a ticker.
| Class | What it means |
| ---------------------------------- | ----------------------------------------------------------------------------- |
| **Entrenched incumbent** | Files audited statements, very large, long-established, generates cash. |
| **Established operator** | Real revenue or headcount, years of history, and covers its own costs. |
| **Funded scale-up** | Past the fragility of a small team, still funded rather than self-sustaining. |
| **Early-stage, capital-dependent** | Small or young, and dependent on the next raise. |
| **Distress signals present** | Insolvency, closure, or cash running out. |
Each class occupies its own score range, and the ranges are ordered so that an early-stage company cannot out-rank an established one on inference alone. That is what stops a startup that raised last quarter from scoring above a profitable incumbent whose ratios are merely typical.
Two things the class does **not** do. It does not override evidence: a bankruptcy filing or a going-concern opinion drives the score straight through any floor. And it is not a judgement about quality, since an early-stage vendor may be an excellent supplier. It only describes what would happen if their funding stopped.
## Runway and burn for private companies
For a vendor that files nothing, the page estimates how long its cash lasts.
Nobody outside the company knows the real figure. The aim is not to guess it but to bound it well enough to separate a vendor with two years of cover from one with two quarters. That is the difference that matters over a contract term.
The estimate is built from what can be observed:
Fully-loaded cost per employee is the operating figure that behaves most predictably across software companies, and headcount is the input most often available. Personnel is grossed up to a total operating cost, and the per-head figure is adjusted for the company's stage.
A dollar of revenue does not fund a dollar of burn. Where no revenue figure is available, a conservative estimate for the company's stage stands in.
Companies raise before they are empty, so the round is credited with a reserve on top, and consumption is charged from the date of the raise.
Most sources report the size of a private round but not when it closed. Assuming it closed yesterday would flatter every vendor, and assuming a fixed number of months would penalize the ones with a large payroll. Observing a company at an unknown point in its funding cycle means observing it, on average, halfway through, so half the round is treated as already spent.
You will see a **range**, not a single number. Treat the low end as the planning figure.
Two related readings appear alongside it. **Self-sustaining** means revenue covers burn, so no cliff applies to that company. **Capital efficiency** is revenue per dollar raised, which separates a disciplined business from one that has bought its growth.
These are estimates, and they are labeled as such. Use them to rank and to prompt a question, not as a figure to quote back to the vendor.
## Where funding and headcount come from when there is no data subscription
Most private vendors are not in any paid financial database you have licensed, and the ones that are may not be covered. The page also reads the funding round, round type, employee count and founding year that Coverbase's own enrichment researched from public sources for that vendor, and feeds them into the runway model above.
Those figures are cited as **Web research** in the sources list, and they never raise the vendor's confidence tier, because a search result is not a filing however precise it looks. What they do is give a page that previously said nothing a cost base, a cash position and a stability class.
Where a licensed provider does answer, its figure wins. Web research only fills the gaps.
## When almost nothing resolved
A vendor with only one or two signals is capped at the middle of the scale, and the page says so under the comparability adjustments.
The reason is that most of a score built on nothing comes from the adverse-events pillar finding nothing, which for a company nobody publishes anything about is an absence rather than a finding. A thin scorecard can report what it found, but it should not read as reassurance.
## What each pillar covers
The score rolls up several pillars, and each expands to show the vitals behind it.
Read the pillars before the total when the score is doing something surprising. A drop driven by corporate standing is a different conversation from a drop driven by growth signals, and only one of them is urgent.
An empty adverse-events pillar is worth understanding. For a company whose filings we read, no events means nothing was disclosed. For a private company, it means nothing was observed, since our event coverage there is limited, so a clean slate is scored well but not perfectly.
## Score over time
Each point is a restatement of the whole scorecard, not a daily reading. Shaded zones mark the risk bands.
Watch for a step that coincides with a change of confidence tier. That is us getting better data about the vendor rather than the vendor changing, and the chart says so when it happens.
## The financial vitals
The measured figures behind the score, grouped the way a credit reviewer reads them: scale and growth, profitability and cash, liquidity and leverage, capital and ownership, corporate standing.
Fields no source reported are left out rather than shown as zero. For a private company, "not reported" and "zero" are different facts, and the page will not conflate them.
## Peer benchmarks
Where a vendor sits against companies of comparable industry and size. The cohort is named, along with how many companies are in it.
If the page says a fallback cohort was used, the vendor's own industry had too few scored peers and the percentile is against a broader set than the label suggests. Read it as directional.
## Adverse events
Dated, sourced events that moved the score, each with a link to what reported it. Severity decays with age, so an old event counts for less than a recent one of the same kind.
Events awaiting review are shown but do not move the number.
## Comparability adjustments
When a stability floor or ceiling changed the score, the page says so, with the reason and the before-and-after figures.
A vendor floored at its class minimum and a vendor that earned the same number on its own signals are different situations, and a corrected score that looked like a computed one would hide that.
## Where the numbers came from
Every source behind the score with the date it was last seen, links out where a register publishes a stable per-company page, and the sources that were asked for and did not answer.
A cap or floor applied by a hard rule, such as a bankruptcy filing, is listed here with its reason.
## Where it shows up elsewhere
The score feeds the Financial health component of a [Zero Touch Score](/user-guides/zero-touch-assessments), carrying its tier through as the component's qualifier.
If a vendor has no Financial Health Score, the Zero Touch component is left out of the composite rather than scored as zero. A vendor with no filed financials has not failed the component; it has no component.
## Troubleshooting
| Symptom | Fix |
| ---------------------------------------------------------- | ---------------------------------------------------------------------------------------------------------------------------------------------------------------------- |
| Not yet scored | The vendor has not been resolved to a filer or a registry record yet. Check the Registrations tab first, since identifiers are how a vendor is matched to filings. |
| The score looks high for a company you know is struggling | Check the stability class and the runway. A funded early-stage vendor is capped, but "no bad news reported" still counts for something on a company nobody reports on. |
| Two vendors you would rank differently have the same score | Check whether a comparability adjustment fired on either. A vendor sitting at its class floor did not earn that number on its own signals. |
| The runway figure looks wrong | It is modeled from headcount and funding, not reported. The page lists the assumptions behind it, and the range matters more than the midpoint. |
| Revenue or headcount look wrong | Both are estimates at lower tiers. The vitals list names the source for each figure. |
| The score changed with no news | Filings and funding data refresh on their own schedule. The scorecard records when each input was last seen. |
## Related
The other outside-in score on the same vendor.
How a vendor is resolved to its filings.
## The summary at the top
Before the pillars, the page answers three questions in one or two lines: what the score was built on, how much that evidence is worth, and how stable the company is.
The first line comes from the scorecard itself: the evidence basis, how many sources and signals went in, the stability class, and the runway verdict. Where a model summary is available, a second line adds a plain-language read of this specific vendor. It is marked as AI-generated and is written only from the evidence listed further down the page.
On a vendor you have never looked at, the summary is usually enough on its own.
## The tier tells you what the number is worth
A 72 backed by audited filings and a 72 inferred from funding rounds and headcount signals are not the same claim. The confidence tier tells you which you are looking at. Mention it whenever a score surprises you.
Tier reflects what data was available, not how the vendor is doing. A private company with no filing obligation lands in a lower tier because of its jurisdiction and structure, not because anything is wrong.
Scores used to be comparable only within a tier. They are now held to a common scale across tiers by the stability class below, so ranking a portfolio on the raw number is reasonable. The tier still tells you how much evidence stands behind any individual result.
## How stable is this company
Companies do not all survive the same way, so one number cannot order them unless something says what kind of company each one is. The **stability class** does that, from what can be observed: scale, operating history, whether the business generates cash, and how dependent it is on outside capital. Never from a name or a ticker.
| Class | What it means |
| ---------------------------------- | ----------------------------------------------------------------------------- |
| **Entrenched incumbent** | Files audited statements, very large, long-established, generates cash. |
| **Established operator** | Real revenue or headcount, years of history, and covers its own costs. |
| **Funded scale-up** | Past the fragility of a small team, still funded rather than self-sustaining. |
| **Early-stage, capital-dependent** | Small or young, and dependent on the next raise. |
| **Distress signals present** | Insolvency, closure, or cash running out. |
Each class occupies its own score range, and the ranges are ordered so that an early-stage company cannot out-rank an established one on inference alone. That is what stops a startup that raised last quarter from scoring above a profitable incumbent whose ratios are merely typical.
Two things the class does **not** do. It does not override evidence: a bankruptcy filing or a going-concern opinion drives the score straight through any floor. And it is not a judgement about quality, since an early-stage vendor may be an excellent supplier. It only describes what would happen if their funding stopped.
## Runway and burn for private companies
For a vendor that files nothing, the page estimates how long its cash lasts.
Nobody outside the company knows the real figure. The aim is not to guess it but to bound it well enough to separate a vendor with two years of cover from one with two quarters. That is the difference that matters over a contract term.
The estimate is built from what can be observed:
Fully-loaded cost per employee is the operating figure that behaves most predictably across software companies, and headcount is the input most often available. Personnel is grossed up to a total operating cost, and the per-head figure is adjusted for the company's stage.
A dollar of revenue does not fund a dollar of burn. Where no revenue figure is available, a conservative estimate for the company's stage stands in.
Companies raise before they are empty, so the round is credited with a reserve on top, and consumption is charged from the date of the raise.
Most sources report the size of a private round but not when it closed. Assuming it closed yesterday would flatter every vendor, and assuming a fixed number of months would penalize the ones with a large payroll. Observing a company at an unknown point in its funding cycle means observing it, on average, halfway through, so half the round is treated as already spent.
You will see a **range**, not a single number. Treat the low end as the planning figure.
Two related readings appear alongside it. **Self-sustaining** means revenue covers burn, so no cliff applies to that company. **Capital efficiency** is revenue per dollar raised, which separates a disciplined business from one that has bought its growth.
These are estimates, and they are labeled as such. Use them to rank and to prompt a question, not as a figure to quote back to the vendor.
## Where funding and headcount come from when there is no data subscription
Most private vendors are not in any paid financial database you have licensed, and the ones that are may not be covered. The page also reads the funding round, round type, employee count and founding year that Coverbase's own enrichment researched from public sources for that vendor, and feeds them into the runway model above.
Those figures are cited as **Web research** in the sources list, and they never raise the vendor's confidence tier, because a search result is not a filing however precise it looks. What they do is give a page that previously said nothing a cost base, a cash position and a stability class.
Where a licensed provider does answer, its figure wins. Web research only fills the gaps.
## When almost nothing resolved
A vendor with only one or two signals is capped at the middle of the scale, and the page says so under the comparability adjustments.
The reason is that most of a score built on nothing comes from the adverse-events pillar finding nothing, which for a company nobody publishes anything about is an absence rather than a finding. A thin scorecard can report what it found, but it should not read as reassurance.
## What each pillar covers
The score rolls up several pillars, and each expands to show the vitals behind it.
Read the pillars before the total when the score is doing something surprising. A drop driven by corporate standing is a different conversation from a drop driven by growth signals, and only one of them is urgent.
An empty adverse-events pillar is worth understanding. For a company whose filings we read, no events means nothing was disclosed. For a private company, it means nothing was observed, since our event coverage there is limited, so a clean slate is scored well but not perfectly.
## Score over time
Each point is a restatement of the whole scorecard, not a daily reading. Shaded zones mark the risk bands.
Watch for a step that coincides with a change of confidence tier. That is us getting better data about the vendor rather than the vendor changing, and the chart says so when it happens.
## The financial vitals
The measured figures behind the score, grouped the way a credit reviewer reads them: scale and growth, profitability and cash, liquidity and leverage, capital and ownership, corporate standing.
Fields no source reported are left out rather than shown as zero. For a private company, "not reported" and "zero" are different facts, and the page will not conflate them.
## Peer benchmarks
Where a vendor sits against companies of comparable industry and size. The cohort is named, along with how many companies are in it.
If the page says a fallback cohort was used, the vendor's own industry had too few scored peers and the percentile is against a broader set than the label suggests. Read it as directional.
## Adverse events
Dated, sourced events that moved the score, each with a link to what reported it. Severity decays with age, so an old event counts for less than a recent one of the same kind.
Events awaiting review are shown but do not move the number.
## Comparability adjustments
When a stability floor or ceiling changed the score, the page says so, with the reason and the before-and-after figures.
A vendor floored at its class minimum and a vendor that earned the same number on its own signals are different situations, and a corrected score that looked like a computed one would hide that.
## Where the numbers came from
Every source behind the score with the date it was last seen, links out where a register publishes a stable per-company page, and the sources that were asked for and did not answer.
A cap or floor applied by a hard rule, such as a bankruptcy filing, is listed here with its reason.
## Where it shows up elsewhere
The score feeds the Financial health component of a [Zero Touch Score](/user-guides/zero-touch-assessments), carrying its tier through as the component's qualifier.
If a vendor has no Financial Health Score, the Zero Touch component is left out of the composite rather than scored as zero. A vendor with no filed financials has not failed the component; it has no component.
## Troubleshooting
| Symptom | Fix |
| ---------------------------------------------------------- | ---------------------------------------------------------------------------------------------------------------------------------------------------------------------- |
| Not yet scored | The vendor has not been resolved to a filer or a registry record yet. Check the Registrations tab first, since identifiers are how a vendor is matched to filings. |
| The score looks high for a company you know is struggling | Check the stability class and the runway. A funded early-stage vendor is capped, but "no bad news reported" still counts for something on a company nobody reports on. |
| Two vendors you would rank differently have the same score | Check whether a comparability adjustment fired on either. A vendor sitting at its class floor did not earn that number on its own signals. |
| The runway figure looks wrong | It is modeled from headcount and funding, not reported. The page lists the assumptions behind it, and the range matters more than the midpoint. |
| Revenue or headcount look wrong | Both are estimates at lower tiers. The vitals list names the source for each figure. |
| The score changed with no news | Filings and funding data refresh on their own schedule. The scorecard records when each input was last seen. |
## Related
The other outside-in score on the same vendor.
How a vendor is resolved to its filings.