> ## Documentation Index
> Fetch the complete documentation index at: https://docs.coverbase.com/llms.txt
> Use this file to discover all available pages before exploring further.
# Program Insights
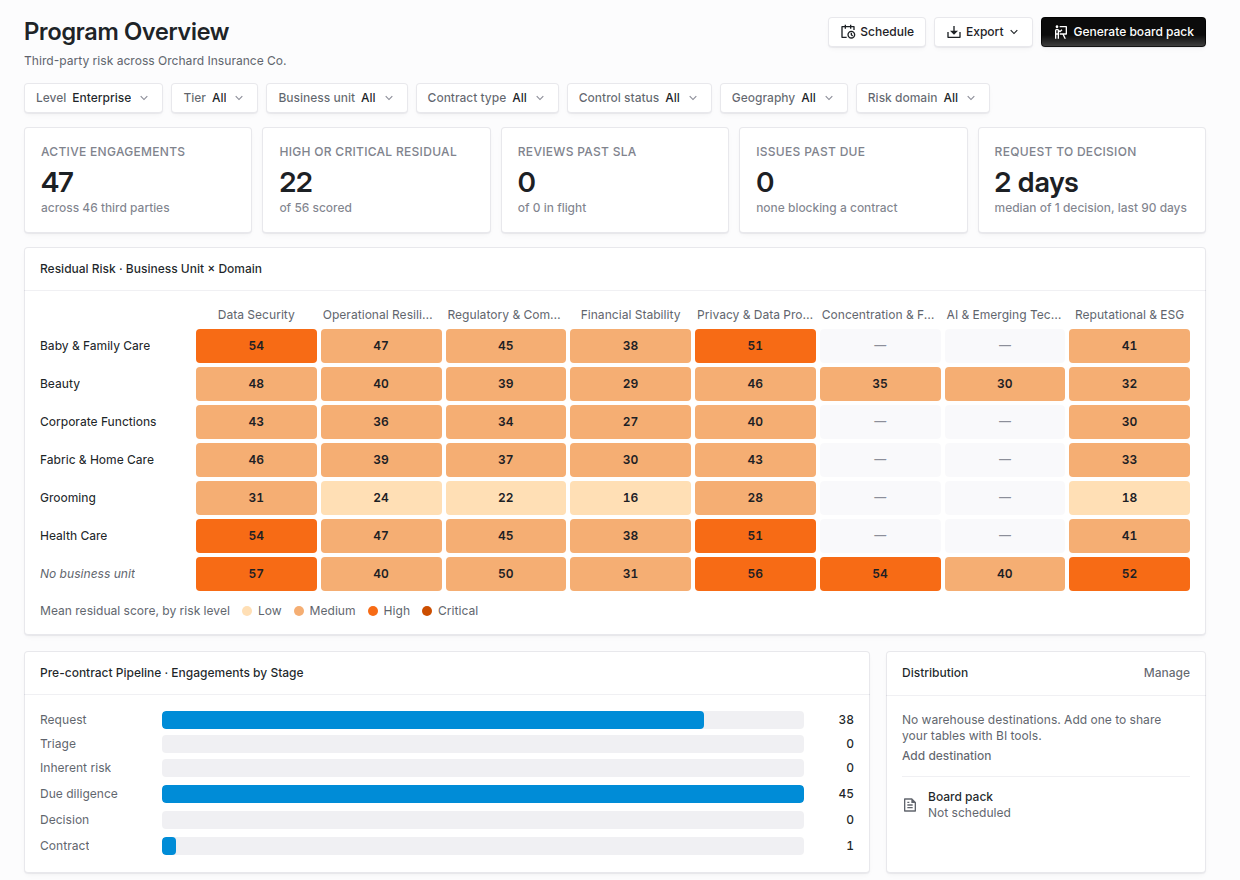
> Read Program Overview: choose a level, apply slicers, read the five KPIs, the residual heat grid and the pre-contract pipeline, open the list behind any figure, export the view, and generate the board pack.
For AI agents: a documentation index is available at [https://docs.coverbase.com/llms.txt](https://docs.coverbase.com/llms.txt). This page is also available in markdown by appending .md to the URL.
This guide is part of the [User Guides](/user-guides/overview) collection. It covers **Program Overview**, under **Dashboards** in the left navigation. It sits beside [Dashboards and the chart library](/user-guides/dashboard-library) and [Warehouse data share](/user-guides/warehouse-data-share). For what the page is, see [Program Insights](/products/program-insights).
Program Overview is a single page for the state of your third-party risk program. You choose how to count (the level), narrow it with slicers, and open the list behind any figure.
Your Coverbase representative turns on the third-party lifecycle features for your organization.
The mistake people make most often is comparing figures taken at different levels. The **Enterprise** level counts each third party at its worst domain score across its engagements, so it reads higher than the **Third party** level for the same portfolio. Name the level when you quote a number.
## Step 1: Open the page
Open **Dashboards** in the left navigation and choose **Program Overview**. Seeing it needs permission to view dashboards.
 ## Step 2: Choose a level and slicers
Under **Level**, choose **Enterprise**, **Engagement** or **Third party**. The description under it says how rows are scored.
Then narrow the view with the slicers: **Tier**, **Business unit**, **Contract type**, **Control status**, **Geography** and **Risk domain**. Each one opens a searchable list. **Geography** lists regions (such as **EU**, **North America** and **Latin America**) above single countries; a region matches a third party with an active site in any of its countries. **Clear** removes every slicer at once.
Business units appear in your organization's order everywhere, on the grid and in the slicer. To change it, go to **Settings** > **Contract Setup Lists** and click **Reorder** next to business units; drag a unit, or use the arrow buttons or keyboard, then save. Units not yet placed follow, by name.
The level and slicers are kept in the page's address, so copying the link shares exactly this view.
## Step 3: Read the KPIs
| KPI | What it counts |
| - | - |
| **Active Engagements** | Live engagements, less those the Transaction Owner decided not to proceed with and those whose exit completed, and how many third parties they span. An engagement with an exit under way still counts until its exit completes. |
| **High or Critical Residual** (named after your elevated levels) | Rows whose residual level is one of the top two levels of your default risk scale (the top one on a scale of three or fewer), out of those scored, with the change since the start of the quarter (UTC). With a **Risk domain** slicer, a row counts when any selected domain is elevated. |
| **Reviews Past SLA** | Open domain reviews past their SLA, out of those in flight. |
| **Issues Past Due** | Open findings past their due date on third parties in scope, and how many engagements at Decision or Contract they block. |
| **Request to Decision** | The median days from the request (the engagement's creation, or an earlier intake for a linked assessment) to the Transaction Owner's decision, over decisions in the last 90 days. |
Click a KPI to open the list it counts.
## Step 4: Read the heat grid
**Residual Risk · Business Unit × Domain** shows the mean residual score (0 to 100) for each business unit and risk domain, coloured by the risk level it falls in. Engagements decided not to proceed, and engagements whose exit completed, are left out. Hover a cell for its mean, its risk level, how many were scored and how many sit at the elevated levels. Click a cell to open the list. **No business unit** collects records that have none.
### Drill into a business unit or an engagement
Click a business unit to narrow every figure on the page to it; the grid then lists its third parties or engagements as rows, worst first (the first 50, with the total). Click an engagement to see it on its own: it is counted at the engagement level whatever the level switch says, and only the **Risk domain** slicer still applies. **Back to the business unit** and **Back to all business units** step back out. The drill is part of the link too.
## Step 5: Read the pipeline
**Pre-contract Pipeline · Engagements by Stage** counts open intake requests (submitted or in review, not yet decided) at **Request**, then live engagements at **Triage**, **Inherent risk**, **Due diligence**, **Decision** and **Contract**. Click a bar to open those engagements.
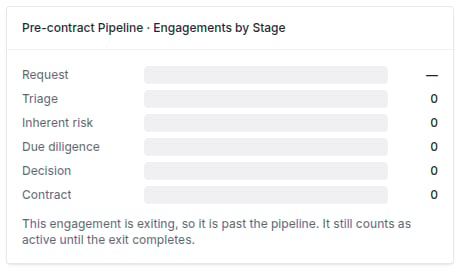
An engagement that is active, exiting or exited is past the pipeline and has no bar. When you drill into one, a line under the bars says so: an exiting engagement still counts as active until the exit completes, and an exited one is out of the program's figures.
## Step 2: Choose a level and slicers
Under **Level**, choose **Enterprise**, **Engagement** or **Third party**. The description under it says how rows are scored.
Then narrow the view with the slicers: **Tier**, **Business unit**, **Contract type**, **Control status**, **Geography** and **Risk domain**. Each one opens a searchable list. **Geography** lists regions (such as **EU**, **North America** and **Latin America**) above single countries; a region matches a third party with an active site in any of its countries. **Clear** removes every slicer at once.
Business units appear in your organization's order everywhere, on the grid and in the slicer. To change it, go to **Settings** > **Contract Setup Lists** and click **Reorder** next to business units; drag a unit, or use the arrow buttons or keyboard, then save. Units not yet placed follow, by name.
The level and slicers are kept in the page's address, so copying the link shares exactly this view.
## Step 3: Read the KPIs
| KPI | What it counts |
| - | - |
| **Active Engagements** | Live engagements, less those the Transaction Owner decided not to proceed with and those whose exit completed, and how many third parties they span. An engagement with an exit under way still counts until its exit completes. |
| **High or Critical Residual** (named after your elevated levels) | Rows whose residual level is one of the top two levels of your default risk scale (the top one on a scale of three or fewer), out of those scored, with the change since the start of the quarter (UTC). With a **Risk domain** slicer, a row counts when any selected domain is elevated. |
| **Reviews Past SLA** | Open domain reviews past their SLA, out of those in flight. |
| **Issues Past Due** | Open findings past their due date on third parties in scope, and how many engagements at Decision or Contract they block. |
| **Request to Decision** | The median days from the request (the engagement's creation, or an earlier intake for a linked assessment) to the Transaction Owner's decision, over decisions in the last 90 days. |
Click a KPI to open the list it counts.
## Step 4: Read the heat grid
**Residual Risk · Business Unit × Domain** shows the mean residual score (0 to 100) for each business unit and risk domain, coloured by the risk level it falls in. Engagements decided not to proceed, and engagements whose exit completed, are left out. Hover a cell for its mean, its risk level, how many were scored and how many sit at the elevated levels. Click a cell to open the list. **No business unit** collects records that have none.
### Drill into a business unit or an engagement
Click a business unit to narrow every figure on the page to it; the grid then lists its third parties or engagements as rows, worst first (the first 50, with the total). Click an engagement to see it on its own: it is counted at the engagement level whatever the level switch says, and only the **Risk domain** slicer still applies. **Back to the business unit** and **Back to all business units** step back out. The drill is part of the link too.
## Step 5: Read the pipeline
**Pre-contract Pipeline · Engagements by Stage** counts open intake requests (submitted or in review, not yet decided) at **Request**, then live engagements at **Triage**, **Inherent risk**, **Due diligence**, **Decision** and **Contract**. Click a bar to open those engagements.
An engagement that is active, exiting or exited is past the pipeline and has no bar. When you drill into one, a line under the bars says so: an exiting engagement still counts as active until the exit completes, and an exited one is out of the program's figures.
 ## Step 6: Export and distribute
* **Export** saves the view as **Excel (.xlsx)** or **CSV**, with the level, the time it was generated, the KPIs, the heat grid and the pipeline.
* **Generate board pack** builds the board pack and downloads it when it is ready.
* The **Distribution** card lists where the program's data goes: each warehouse destination with its last sync, the Power BI feed (the Snowflake destination it reads, with its health), the board pack schedule, scheduled dashboard emails, and a link to your own open tasks. **Manage** opens [Data Share](/user-guides/warehouse-data-share).
## Troubleshooting
| What you see | Cause | Fix |
| - | - | - |
| No **Program Overview** under **Dashboards** | The third-party lifecycle features are not turned on for your organization, or your role cannot view dashboards. | Ask your Coverbase representative, or an admin. |
| An offboarded engagement is missing from the figures | Its exit completed. | Expected. Exited engagements leave the program's figures. |
| **No residual scores yet** | No assessment has set residual risk by domain. | Complete assessments with domain residual scores. |
| **Nothing scored matches these slicers.** | The slicers exclude everything. | **Clear slicers**. |
| The opened list shows more rows than the figure | Most drills filter the list exactly. Enterprise level risk figures, the elevated KPI with a risk domain slicer, and issues at the engagement level name up to 100 matching rows instead, so a larger set cannot be listed exactly. | Expected. The page warns before you open it. |
| **Couldn't refresh this view.** | The latest figures failed to load. The page keeps the last view that loaded. | Click **Retry**. |
## Related
Your own dashboards.
The stages the pipeline counts.
The destinations on the Distribution card.
What the page is.
This documentation is built and hosted on [Mintlify](https://mintlify.com), a developer documentation platform.
## Step 6: Export and distribute
* **Export** saves the view as **Excel (.xlsx)** or **CSV**, with the level, the time it was generated, the KPIs, the heat grid and the pipeline.
* **Generate board pack** builds the board pack and downloads it when it is ready.
* The **Distribution** card lists where the program's data goes: each warehouse destination with its last sync, the Power BI feed (the Snowflake destination it reads, with its health), the board pack schedule, scheduled dashboard emails, and a link to your own open tasks. **Manage** opens [Data Share](/user-guides/warehouse-data-share).
## Troubleshooting
| What you see | Cause | Fix |
| - | - | - |
| No **Program Overview** under **Dashboards** | The third-party lifecycle features are not turned on for your organization, or your role cannot view dashboards. | Ask your Coverbase representative, or an admin. |
| An offboarded engagement is missing from the figures | Its exit completed. | Expected. Exited engagements leave the program's figures. |
| **No residual scores yet** | No assessment has set residual risk by domain. | Complete assessments with domain residual scores. |
| **Nothing scored matches these slicers.** | The slicers exclude everything. | **Clear slicers**. |
| The opened list shows more rows than the figure | Most drills filter the list exactly. Enterprise level risk figures, the elevated KPI with a risk domain slicer, and issues at the engagement level name up to 100 matching rows instead, so a larger set cannot be listed exactly. | Expected. The page warns before you open it. |
| **Couldn't refresh this view.** | The latest figures failed to load. The page keeps the last view that loaded. | Click **Retry**. |
## Related
Your own dashboards.
The stages the pipeline counts.
The destinations on the Distribution card.
What the page is.
This documentation is built and hosted on [Mintlify](https://mintlify.com), a developer documentation platform.