

For AI agents: a documentation index is available at https://docs.coverbase.com/llms.txt. This page is also available in markdown by appending .md to the URL.
Program Overview answers the questions a TPRM Office is asked every month: how many engagements are live, how much residual risk sits at the top of the scale and where, what is stuck in the pipeline before contract, and how long a request takes to reach a decision. Every figure opens the list behind it.
Your Coverbase representative turns on the third-party lifecycle features for your organization.
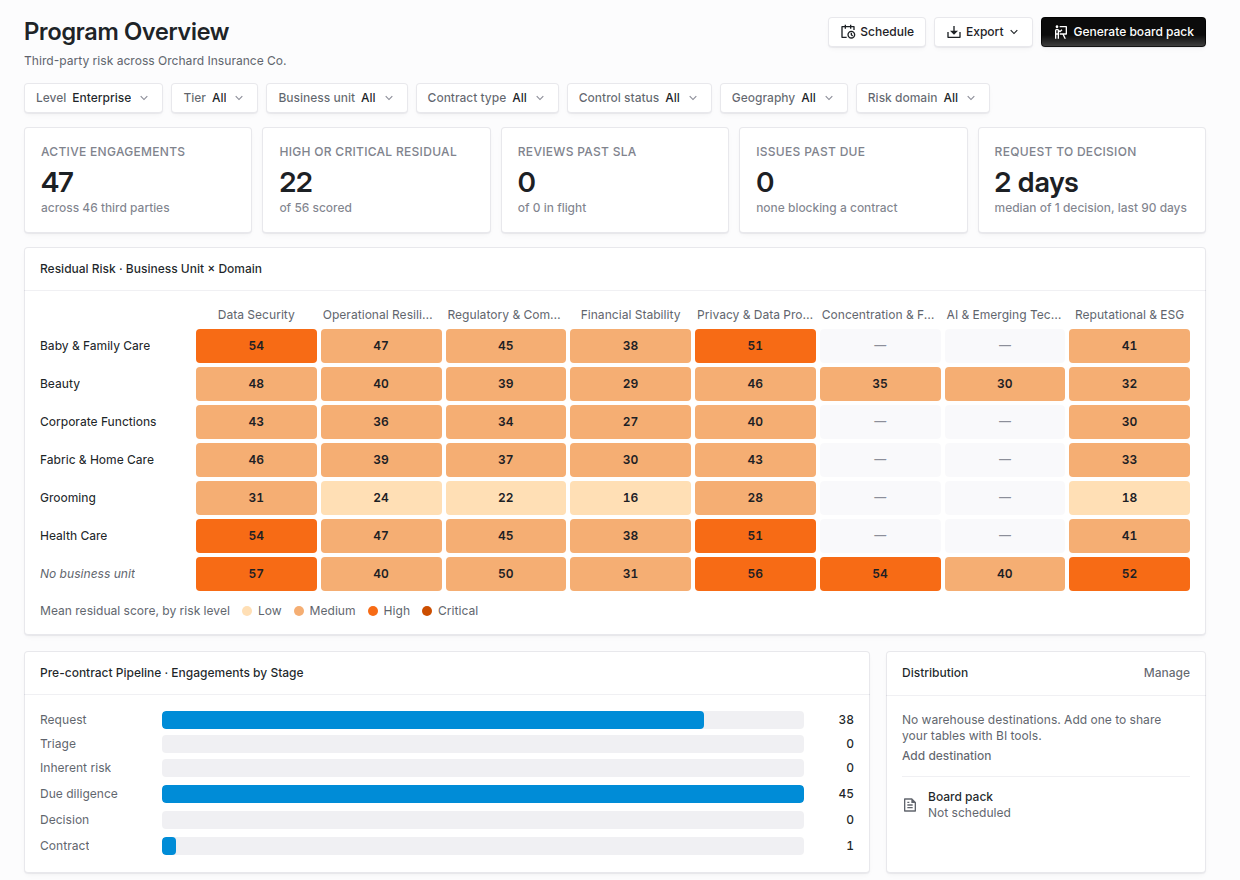
Dashboards → Program Overview at the Enterprise level, with the five KPIs, the residual heat grid, the pre-contract pipeline and the Distribution card.
What it shows
Five KPIs
Active Engagements (including those with an exit under way) across how many third parties; third parties or engagements at your elevated residual risk levels (such as High or Critical), with the change this quarter; Reviews Past SLA out of those in flight; Issues Past Due, with how many block a contract; and the median Request to Decision time over the last 90 days.
Residual risk by business unit and domain
A heat grid of the mean residual score for each business unit and risk domain, coloured by your risk levels, with how many were scored and how many sit at the elevated levels.
Pre-contract pipeline
Requests and engagements by stage, from Request through Triage, Inherent risk, Due diligence and Decision to Contract, until they reach a signed contract. Active, exiting and exited engagements are past the pipeline.
Levels and slicers
View the program at the Enterprise, Engagement or Third party level, and slice it by tier, business unit, contract type, control status, geography and risk domain. The view is held in the link, so sharing the link shares the view.
Drill-downs
Each KPI, heat grid cell and pipeline stage opens the matching vendor, engagement or finding list, filtered to what it counts.
Export and distribution
Export the view to Excel or CSV, generate the board pack, and see on the Distribution card where your program’s data goes: warehouse destinations, the board pack schedule and scheduled dashboard emails.
The three levels
When a list shows more than the figure
When every slicer has a field on the list a figure opens, the list is filtered the same way. Otherwise the drill names the rows by ID, up to 100; past that, the list shows a superset of what the figure counted, and the page says so before you open it.Drill into a business unit or an engagement
From the whole program you can drill into one business unit, which narrows every figure to it and lists its third parties or engagements as the grid’s rows, and then into one engagement. At the Third party level, a row opens the vendor page. The drill is held in the link with the level and slicers.Exiting and exited engagements
An engagement with an exit under way still counts as active, because its contract runs until the exit completes. Once the exit completes, the engagement leaves every figure, the same as an engagement the Transaction Owner decided not to proceed with. A drilled engagement that is active, exiting or exited says so under the pipeline bars.Where to go next
Program Insights guide
Read the page, slice it, drill in and export.
Engagement record
The tracker the pipeline stages come from.
Warehouse data share
The destinations on the Distribution card.
Dashboards and the chart library
Build your own charts on the same data.