

For AI agents: a documentation index is available at https://docs.coverbase.com/llms.txt. This page is also available in markdown by appending .md to the URL.
This guide is part of the User Guides collection. It covers the Inspect screens. For what the module is and how internal and third-party risk share one model, see Internal control monitoring and Agentic Inspect. For the control sets it evaluates, see the Control Set library.
Inspect is an optional module. If you do not see Inspect in the left navigation, ask your Coverbase representative to turn it on.
Where it lives
Inspect in the left navigation opens five tabs: Overview, Inspections, Probes, Applications and Accounts. Configuration at the right of the tab strip opens Configuration → Inspect, where identity providers are connected. Schedules is a button on the Inspections tab, not a tab of its own.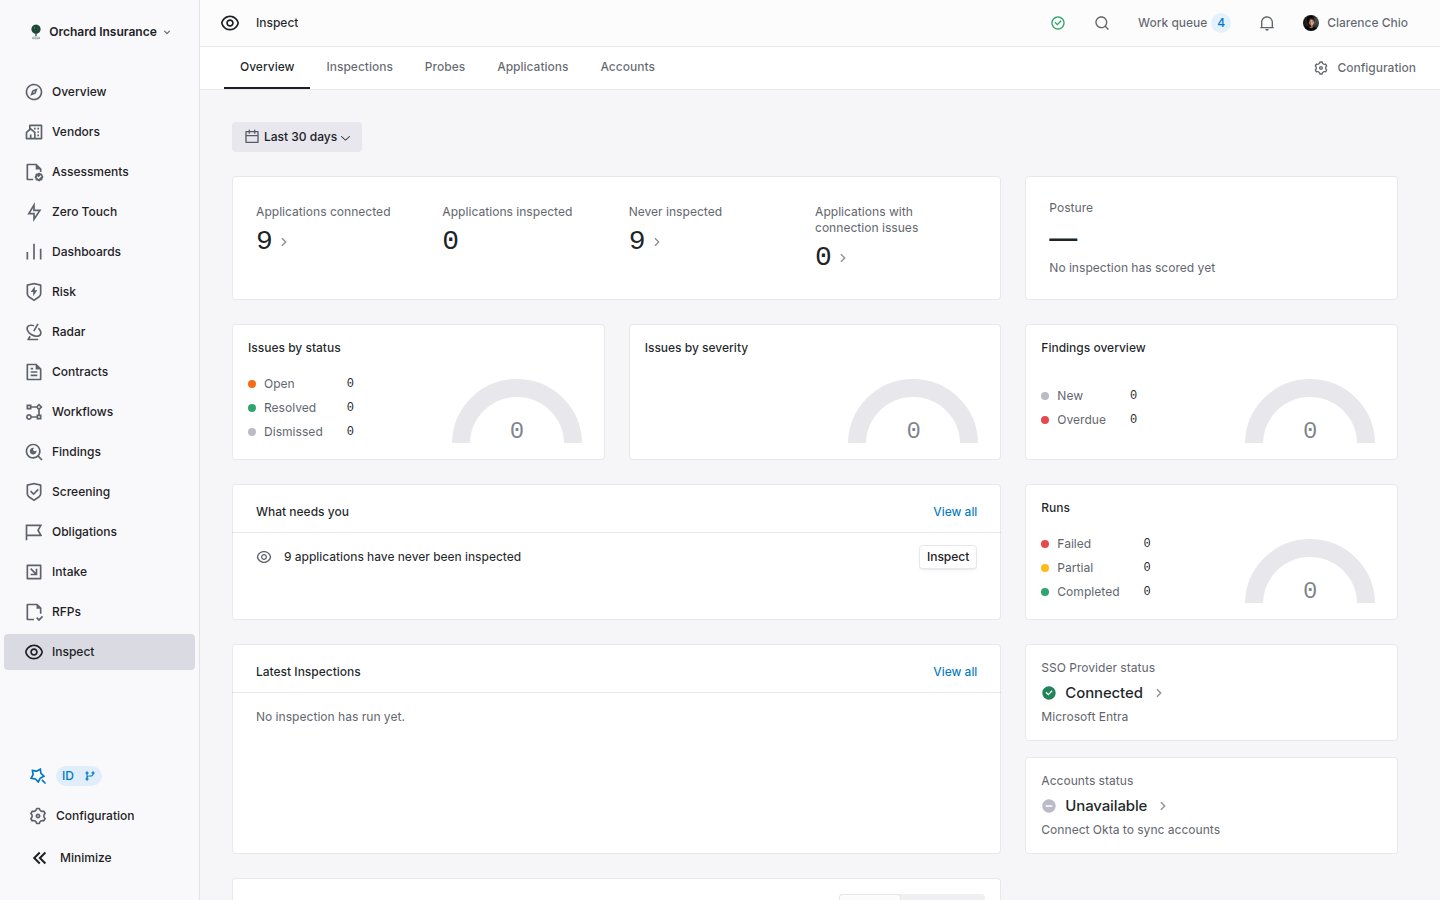
The Overview tab: application tiles, posture, what needs you, and the latest inspections.
Connecting an application
Inspect needs two things from an application: a way to sign in, and a Platform so it knows which documentation and API catalog to plan from. There are two routes in.- Through an identity provider
- Directly
Go to Configuration → Inspect. Each provider card reads Connected, Needs verification, Connection error or Not connected, and shows how many applications are added to Inspect against how many are available in the provider.
1
Okta
Connect Okta walks through App details (your Okta org URL and the Client ID of an API Services app you create for Coverbase Inspect), Configure the Okta connection (add the Coverbase JWKS URL as the app’s public key, grant a Read-only Administrator role for inventory, and grant the Organization Administrator and Application Administrator roles that let Coverbase create the inspection identity), then Choose applications to add.Run Sync from Okta to pull users, applications and assignments. When you add applications, tick the approval box: Coverbase provisions a dedicated read-only inspection identity in Okta and assigns it only the applications you selected. Afterwards, Sign in to Okta under Okta sign-in so the identity has a live session. Its status reads Not signed in, Sign-in started, Signed in, Sign-in expired or Sign-in failed.
2
Microsoft Entra
Connect Microsoft Entra follows the same shape: App details for an application you register in your tenant, Configure the Entra connection to verify the Graph permissions, Sync and select applications, then Prepare applications for inspection. An Entra application without SAML or OIDC single sign-on shows as Blocked in the applications list, because Inspect has no way to sign in to it.
3
Google OAuth
Google OAuth stores the Google account email and password Inspect signs in with, plus an optional TOTP secret. Applications that use Google sign-in are added directly (next tab) and pick up these credentials. Run test inspection checks that the sign-in works before you rely on it.
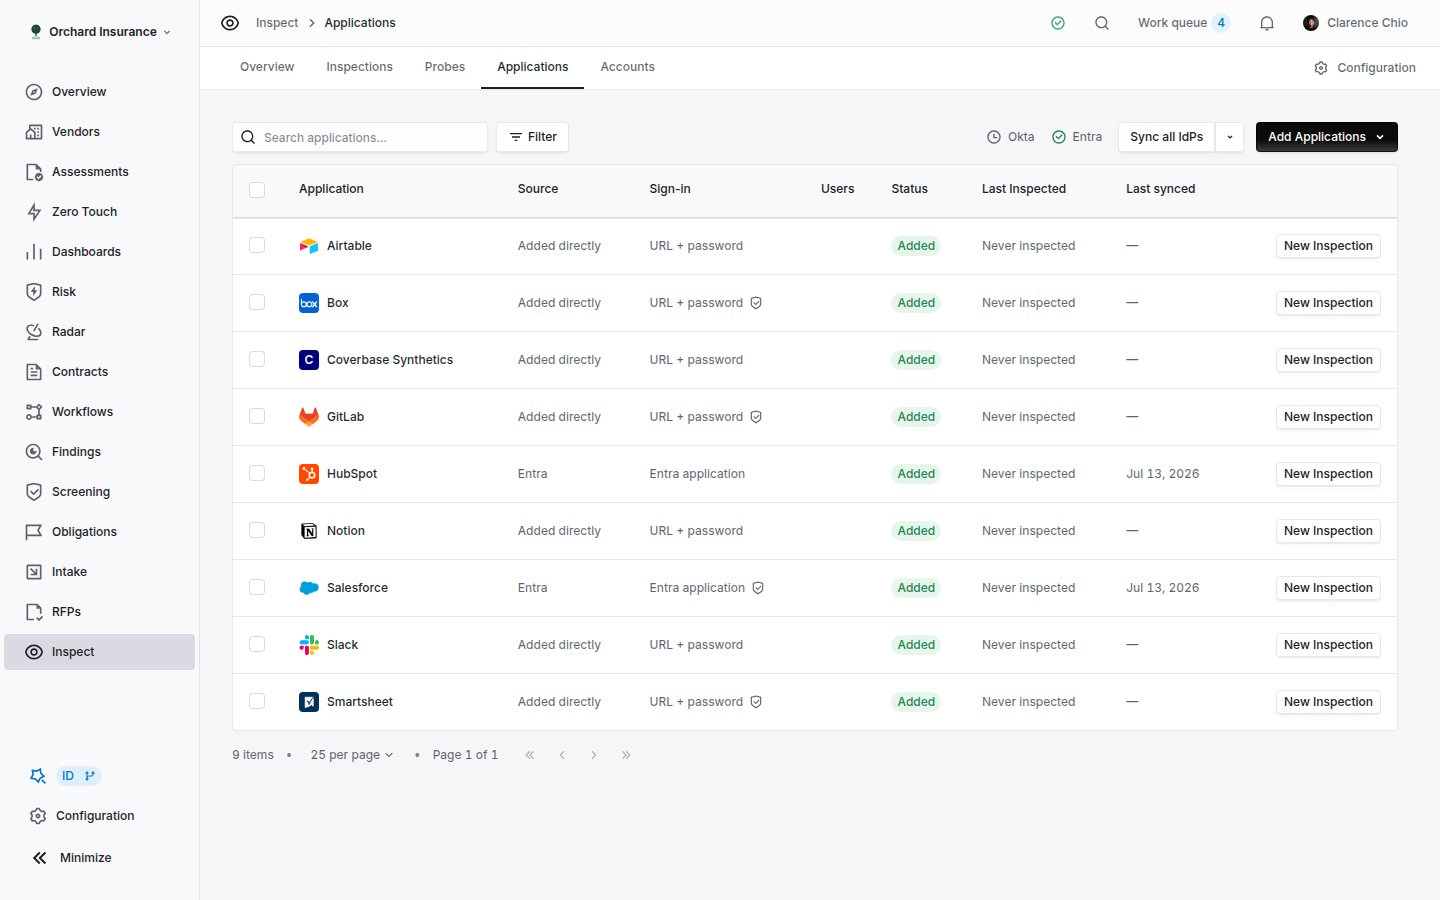
The Applications tab: one row per application, with its source, sign-in method, status and when it was last inspected.
Reading the applications list
Search, filter by source or status, and select rows to Add, Archive, Unarchive or Find vendor matches in bulk. The last one links each application to the vendor record it belongs to, so internal and third-party evidence sit on the same vendor.
Click a row to open the drawer. Summary holds the login URL, status and a Vendor link. Users lists the assigned users, with Admin where the provider profile names an admin role. Factors manages verification factors for the inspection identity. API Settings holds the API origin, credentials and request parameters that API-based evidence needs; identity provider access does not establish API access, so an application can be signed in and still need this tab filled in. Inspection readiness at the foot of the drawer links to Review readiness, which opens the inspection setup with this application selected.
Running an inspection
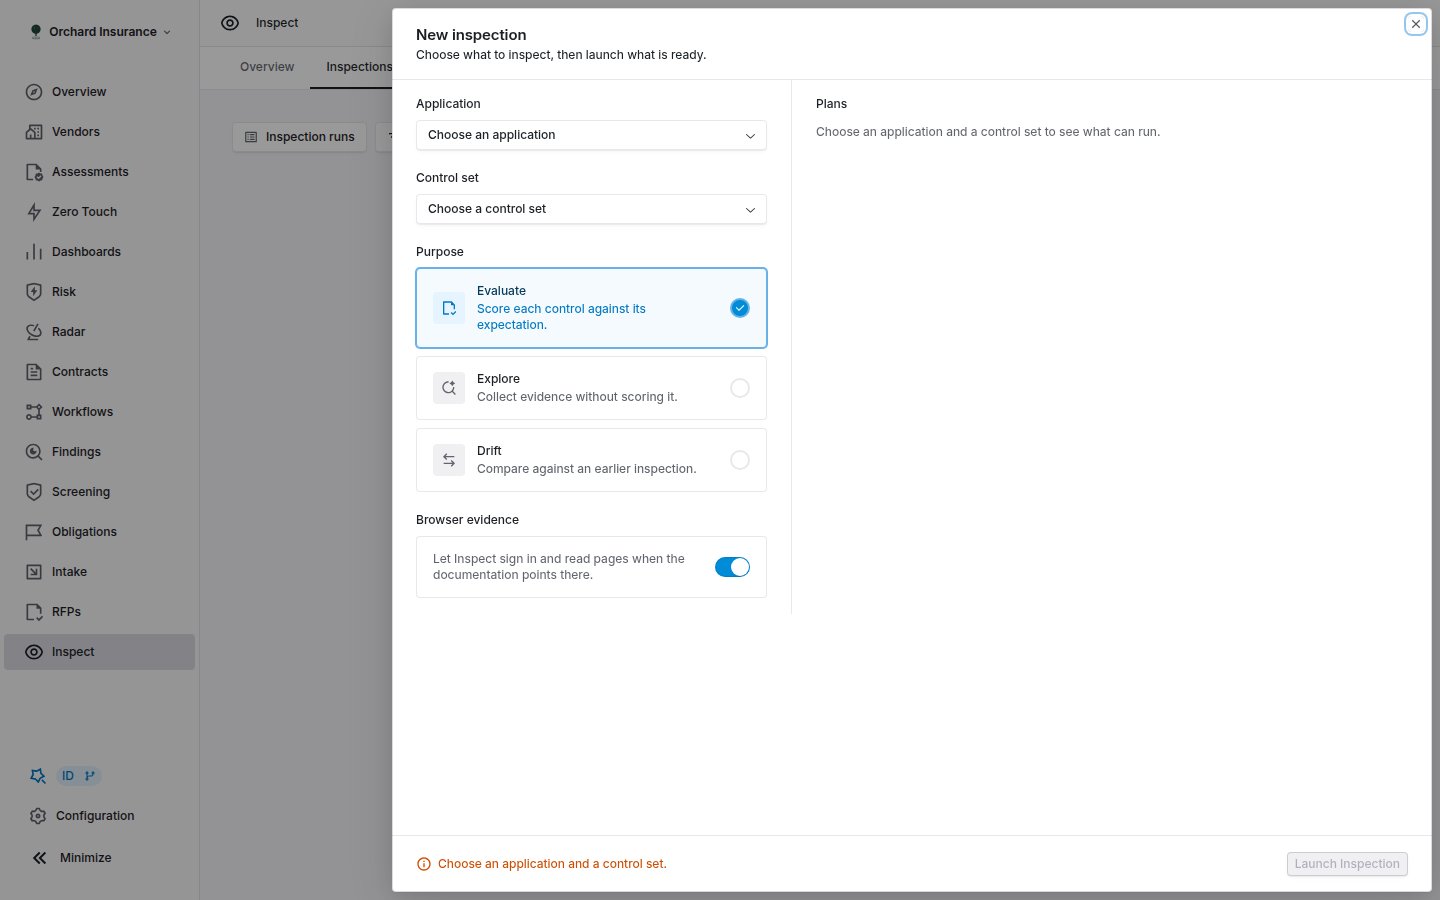
The New inspection panel: application, control set and purpose at the top, then each control's plan readiness.
1
Choose what to inspect
On Inspections, click New Inspection. Pick an Application and a Control set. If the application has no control sets yet, Add Starter Controls forks a starter set so there is something to run. The full set of internal templates lives in the Internal Controls Library, reached from Controls → Internal Controls → Internal Controls Library; a forked template is an ordinary control set you can edit.
2
Choose a purpose
Evaluate needs a scale with an active level on the control set. Without one the launch is refused with None of the selected controls can be evaluated. Apply a scale with an active level, or choose Explore.
3
Decide on browser evidence
Browser evidence lets Inspect sign in and read pages when the documentation points there. Leave it off and only API methods run; the panel tells you how many controls that holds back (Allowing browser evidence releases N controls).
4
Get the plans ready
Every control needs a plan: what evidence to collect and how. The list groups controls into Ready, Preparing, Not prepared and Blocked. Click Prepare Plans for the unprepared ones and wait; a blocker names what is missing (no platform, API origin or credentials not configured, plan preparation failed). Recheck readiness re-reads the configuration after you fix something.
5
Launch
Launch Inspection starts everything that is ready. If only some controls are ready the button says so: X of Y controls will run. The rest will be recorded as not planned. Those controls end as Not planned rather than silently dropped.
Reading an inspection
The Inspections list shows Application, Initiated, Status, Purpose, Control set, Controls finished, Outcomes, Score, Findings and Channel (API or Browser). The default view, Inspection runs, hides probe runs; All inspections includes them. Open a row to read it.Statuses
An inspection carries one status; each control inside it carries its own.Inside a control
Click a control to open its workspace. Evaluation shows the level the control landed on and the Justification written from the evidence; This control has not been evaluated yet and This control could not be fully evaluated are the two states short of a verdict. Observations lists each evidence key with its records, where it was Collected from, the screenshot captures, and Watch replay for the browser session. Activity is the event log. Each observation carries a status, and an absent one is reported rather than skipped:
Row actions: Retry on a failed or blocked control, Rerun on a finished one, Rerun with updated control after you edit the control (a new plan is prepared first), and Cancel. Select several rows to retry, rerun or cancel together. At the top of the page, Actions → Archive removes the inspection from the list, Cancel Inspection stops a running one, and Create schedule turns this application and control set into a monthly run.
Drift between runs
A Drift inspection collects the same evidence as its reference and reports what moved. The header links to View reference inspection. Each control lands in one state:
The comparison panel shows Reference beside This inspection, marks each record Changed, Added or Removed, and hides unchanged records behind Show N unchanged records. If a requirement does not say which fields identify a record, an edited record appears as one removed and one added; the panel says so. Editing a control changes what it collects, which is why Can’t compare appears after a control edit: take a fresh Evaluate run as the new baseline.
From an issue to a finding
Only Evaluate inspections produce evaluations. On a control whose evaluation raised an issue, Create Finding in the Evaluation panel creates a finding with the control’s expectation as its title and the evaluation attached as its source. Clicking again returns the same finding rather than a duplicate; the button then reads View Finding. Coverbase drafts remediation guidance for the finding from the evidence the run collected, so each step can be checked against an observation. From there it is an ordinary finding. On the Findings page, filter Source by Inspect evaluation to see only these. Assign an owner and due date, route it with the same workflows as third-party findings (see Workflow templates), and it counts in the same dashboards (see the Dashboard library). Overdue internal findings surface back on the Inspect Overview under What needs you. The Risk module can also take Inspect as a signal source, reading evaluations marked as issues on internal control sets.Plans and plan versions
A plan is what Inspect prepared for one control on one platform: each Requirement with its question, Comparison focus, Observation contract (what fields to record and how many records to expect) and Evidence methods (Browser, REST, GraphQL, Query or Metadata), plus the Documented destination, What to record and a Suggested route. Reach it with Review Plan in the inspection setup or View plan from a control. Plans are immutable. Edit plan does not change the plan that ran; Publish new version creates the next version and marks the old one superseded. Inspections already running keep the version they started with.
Check changes validates before you publish. A refusal names what was wrong: an empty field, an uneditable part of the plan, a route hint with characters other than letters, numbers, hyphens and underscores, or This plan changed while you were editing, which means someone else published first; reload and reapply.
Two rules about whose plan it is:
- Coverbase maintains this plan. Editing it saves your organization’s own copy. A public plan stays as it is for everyone else, and your copy starts at version 1. From then on your organization sees its own plan, not Coverbase’s later improvements to the public one.
- To edit this Coverbase plan, open it from one of your organization’s controls. Editing needs a control in your organization to hang the copy on.
Probes
An inspection evaluates a control set once. A probe answers one small question on a cadence: is MFA still enforced, did the nightly export land, does this record show the status we expect. Probes sit on their own tab and their runs appear in Inspections under the All inspections view.1
Describe it
On Probes, click New probe. Give it a Name, pick an Application, and answer What should this probe observe? in plain language, naming the view or record and the facts to collect. Click Prepare probe.
2
Review the procedure
Inspect turns the description into Checkpoints that run in order on one browser journey. Each checkpoint lists the Evidence to Collect, its Collection method (Browser or API), and an optional Expectation: a Field, a Comparison (Equals, Greater than, At least, Less than, At most, Is recorded), an Expected value, and whether it Applies To All records or Any record. A checkpoint with no expectation reads Data collection only and contributes no verdict. On Failure decides whether the run should Continue to next checkpoint or Stop remaining checkpoints. Reorder checkpoints, or click Prepare a new procedure to start over.
3
Run it once
Save and run (or Save probe, then Run now) executes the procedure once so you can check each checkpoint before anything repeats. A probe that has not been run shows In preparation.
4
Enable it
Choose a Frequency (Every 15 minutes, Every hour, Every 6 hours or Every day) and click Enable probe. Pause keeps the run history and stops scheduled runs.
Schedules
A schedule reruns an application and control set on a calendar day every month, with no one launching it. Open Inspections → Schedules, then New schedule: choose the Application, Control set, Purpose, whether to Allow browser evidence, and the Day of month. Create schedule on a finished inspection pre-fills the same dialog. Each row shows Cadence (Monthly on the 15th), Next run, Last run and a Status of Active or Paused. Actions offers Edit schedule, Pause, Resume and Stop repeating; the last one keeps past runs in the inspections list and runs nothing further. Before each run Inspect checks sign-in and plan readiness. A run that cannot start is recorded as a missed check and the next occurrence still goes ahead. The inspection page names the cause:A monthly schedule that outlives its application keeps running until you pause or stop it. Archiving the application does not stop the schedule.
The Accounts directory
Accounts is what the provider syncs and the inspections observe, joined into one directory: a person or service identity, the application accounts that belong to it, and the evidence attributed to each account. It fills after the first Okta or Entra sync (Accounts appear once the sync finishes) and refreshes after every inspection. Built-in views: Accounts & evidence (the default: identities with at least one account), All identities, Guests, Admin observed, Observed evidence and Needs attribution. Save your own on top of any of them. Expand an identity to see its Application accounts. Each account states how it was tied to the identity:
Admin observed means an attributed observation once showed admin privileges on that account. It is historical, not a claim about current access. Admin privilege hint is weaker still: the provider’s assignment profile names an admin role, and no inspection has verified the application honors it. Latest observed admin state reads the most recent record: Admin, Not admin, or Unknown when the record carried no privilege attributes.
Rebuild attribution re-derives every account link from the current provider inventory and observations. Use it after changing an application’s platform or when the page says accounts need review.
Who can do what
Inspect is switched on per organization. Within it, access follows the integration permission described in Permissions and roles:Notifications
Inspect sends one email, Inspection needs attention, to the person who started an inspection when it ends Blocked or Failed. It says how many controls were blocked, failed or not planned, and Open inspection takes you to the page. It is on by default and can be turned off under the Inspect category in your notification settings (see Email notifications). Findings created from inspections follow the ordinary finding notifications.Troubleshooting
Related
Internal control monitoring
What the module is for, and how internal and third-party risk share one model.
Control Set library
The internal control sets Inspect evaluates against, with counts and sources.
Findings Manager
Where a finding created from an inspection goes next.
Permissions and roles
The integration and finding permissions this guide refers to.