

For AI agents: a documentation index is available at https://docs.coverbase.com/llms.txt. This page is also available in markdown by appending .md to the URL.
This guide is part of the User Guides collection. It covers getting a dashboard out of Coverbase, as a file or as a recurring email. To build the dashboard first, see Dashboards and the chart library. For assessment reports rather than dashboards, see the Reporting overview.
Where the export options are
Open Dashboards in the left navigation. Each dashboard’s row ends with an actions menu (⋮) that holds:- Export, which opens Export as PDF and Export as Excel
- Schedule export, which opens that dashboard’s schedule
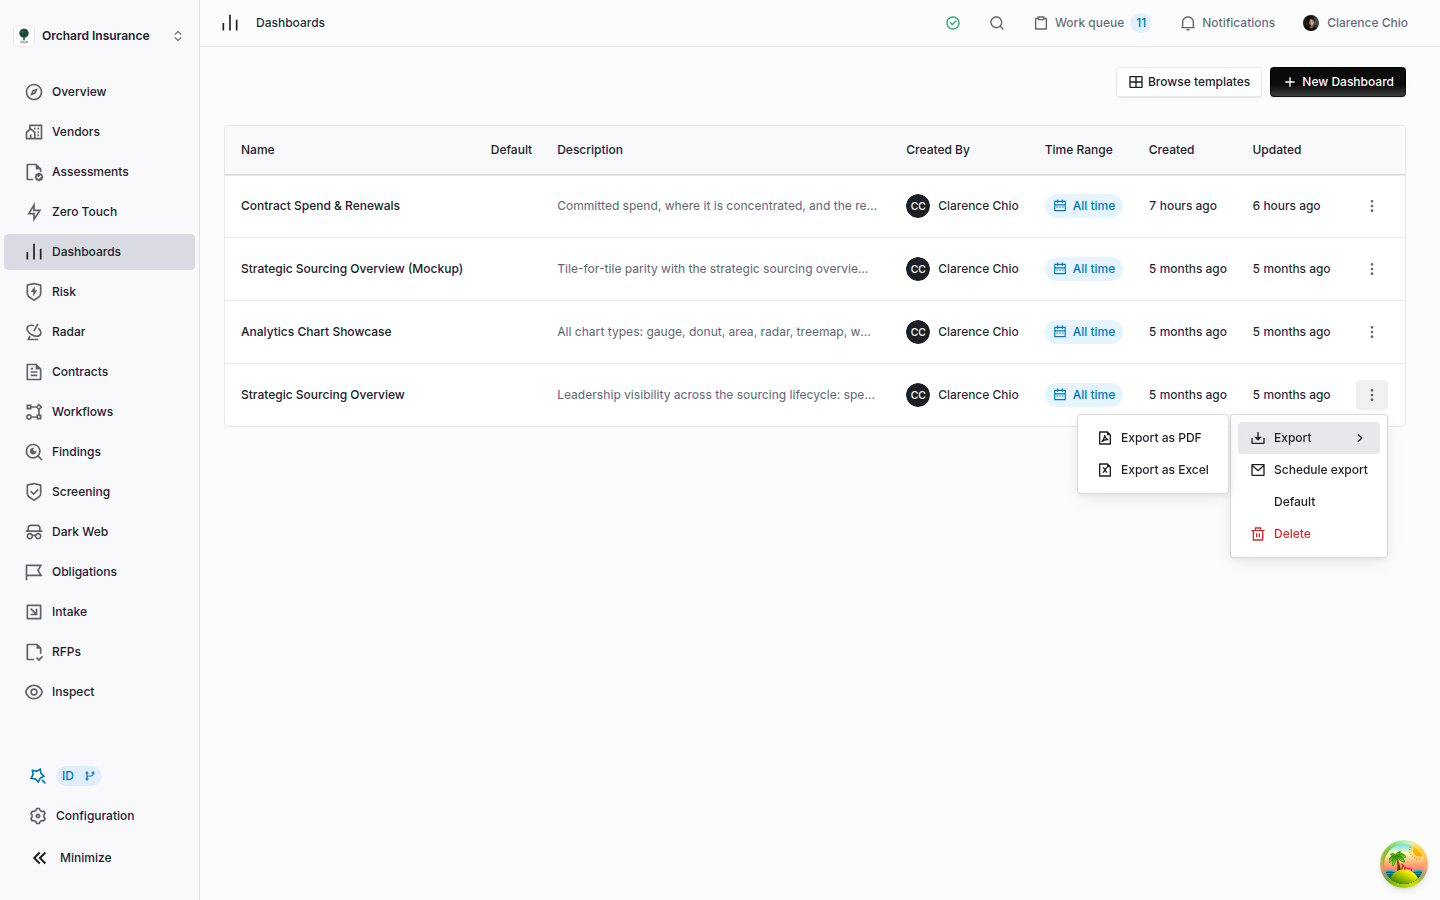
The actions menu on a dashboard's row, with the Export submenu open. Schedule export sits directly below it.
Exporting to PDF or Excel
Use a file for a one-off copy: a board pack, an attachment to a ticket, a spreadsheet to pivot.1
Choose the format
On Dashboards, open the row’s actions menu, point to Export, and choose Export as PDF or Export as Excel.
2
Name the file
Export file name starts as the dashboard’s name. Change it if you like. The extension is added for you.
3
Generate it
Click Generate File. The dialog shows progress while Coverbase builds the file in the background.
4
Download it
When the file is ready, click Download. If you closed the dialog, a notification in the Notifications menu says the report is ready and carries the same Download button. An email follows too if Report ready for download is switched on in your notification settings.
What the PDF contains
- A title block: the dashboard’s name, its description if it has one, and the date and time the file was generated, in your time zone.
- One section per chart: the chart’s name as a heading, then the chart drawn across the full width of a US Letter page.
What the Excel workbook contains
- One sheet per chart, named after the chart. Excel allows 31 characters and no
\ / * ? : [ ]in a sheet name, so long names are shortened, those characters are dropped, and a repeated name gets a number added. - On each sheet, a header row, then one row per data point, with a column for each grouping and each value. A chart split two ways (by owner and by tier, say) comes out as one row per combination rather than a grid, which is the shape a pivot table wants.
- A KPI’s sheet holds a label and a single value.
- Money cells are numbers in a currency format and cycle times are numbers of hours, so the sheet can still add them up.
How each chart type comes out
The workbook carries the numbers behind every chart. The PDF, and the copy of the dashboard in a scheduled email, draw only some chart types.
Bar and line charts in the PDF and in the email cut category labels at 20 characters, so a long vendor name ends in an ellipsis. The workbook keeps it whole.
A chart whose data cannot be loaded keeps its heading and says “The data for this chart is not available.” in all three. That is usually a Radar or Inspect chart, where the module is off for your organization or the person the export runs as cannot see it.
Dates, filters and access
- Date range. An export uses the range saved in the dashboard’s Date Range control. A relative range such as Last 3 months or Month to date is worked out when the file is generated, in your time zone. Only people who can edit the dashboard can change its range.
- Charts with their own range. A chart that carries its own date range (its card shows the range under its name) keeps it in the export, as it does on screen.
- Filters saved on a chart. Filters set in the chart editor apply.
- Filters in the toolbar. If your dashboard’s toolbar has a + beside Date Range for adding filters, those filters are not saved with the dashboard. They change your screen only, and no export or scheduled email sees them. To filter an export, add the filter to each chart in the chart editor.
- Access. An export reads the same data as the dashboard. Radar and Inspect charts also need the person the export runs as to have access to those modules. A PDF or Excel export runs as you. A scheduled email runs as the dashboard’s creator (see Whose schedule it is).
Scheduling a dashboard by email
A schedule emails the dashboard to a list of addresses on the days you pick. Each email can carry the PDF, the workbook, a copy of the dashboard in the message body, or any mix of the three.1
Open the schedule
On Dashboards, open the dashboard’s actions menu and choose Schedule export. The Scheduled Export dialog opens.
2
Switch it on
Tick Enable scheduled export. The rest of the form stays grayed out until you do.
3
Pick when it goes
Under Frequency, choose Daily, Weekly or Monthly. For Weekly, pick one or more Days of the week. For Monthly, pick one or more Days of the month, from 1 to 28.
4
Pick what it carries
Under Attachments, turn on Attach PDF, Attach Excel, or both. Attach PDF is on to start with. Tick Include a copy of the dashboard in the email to draw the charts into the message itself. You need at least one of the three.
5
Add the recipients
In Recipients, type an address and press Enter, then type the next. An address shown in red is not valid and blocks saving. A schedule takes up to 50 addresses.
6
Write the email, if you want to
Subject, Email Title and Message under Email Copy are optional. Left blank, each uses the default wording.
7
Send yourself a test
Click Send test to me. See Testing before you save.
8
Save
Check the Next export line at the bottom of the form, then click Save.
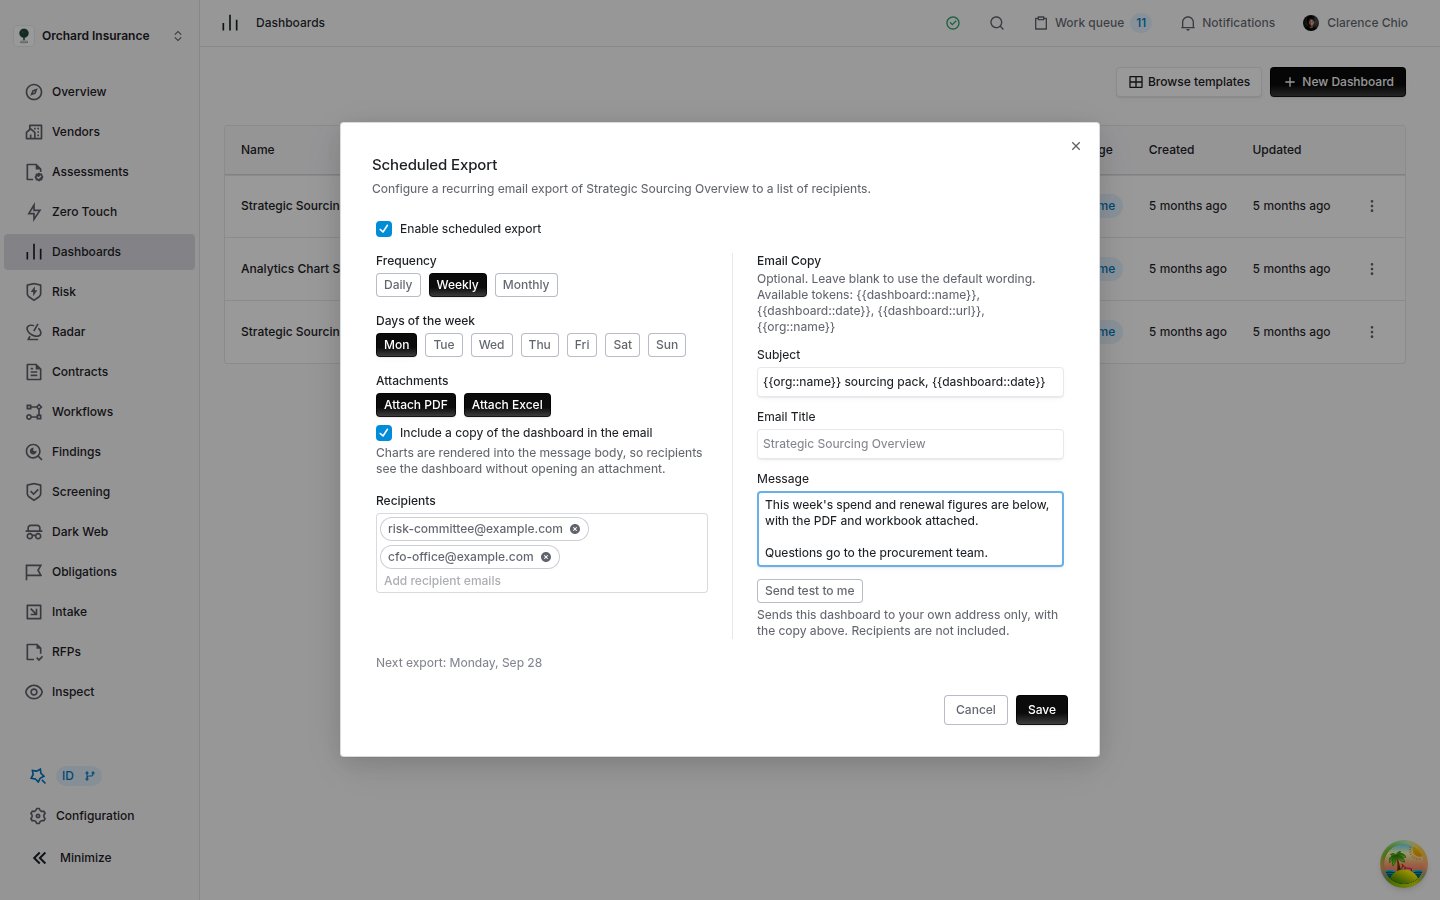
A weekly schedule that sends the PDF, the workbook and a copy of the dashboard every Monday, with a subject built from tokens.
When it sends
- Scheduled emails go out once a day at about 14:00 UTC: 10:00 in New York in summer and 9:00 in winter. You cannot choose the hour.
- Days are counted in US Eastern time, and a schedule has no time zone setting. At UTC+10 or further east, the email lands just after midnight on the following local day.
- The dashboard’s date range is worked out in US Eastern time at the moment of sending, so Last 7 days means the seven days up to that send.
- Next export shows the date of the next send in your own time zone. Once today’s send has gone out, it shows the next matching day.
- Days of the month runs from 1 to 28 so every chosen day exists in every month. There is no option for the last day of the month.
Recipients
- Any address works. Recipients do not need a Coverbase account, and Coverbase does not check them against your members.
- Each recipient gets a message of their own, so nobody sees who else is on the list. A schedule takes up to 50 addresses. For a wider or changing audience, send to a mailing list that your email team maintains.
- The email has no unsubscribe link. It tells the reader that someone in your organization subscribed their address, so anyone who wants to stop receiving it has to ask you.
- The Open dashboard button in the email needs a Coverbase sign-in to your organization. Recipients without one can read the attachments and the copy in the email, not the live dashboard.
The subject, title and message
Message takes Markdown, so you can use bold, links and lists, but not tables. HTML is shown as typed rather than rendered. A message you write replaces both the default line and the dashboard’s description.
Each field can carry these tokens, filled in on every send:
A token with nothing to fill it is left blank rather than printed.
Attachments and the copy in the email
- The attachments are the same files Export as PDF and Export as Excel produce. Each is named after the dashboard with the send date added, for example
Strategic_Sourcing_Overview_2026-09-28.pdf. Spaces and most punctuation in the name become underscores. - The copy in the email follows the chart type table: KPIs and tables as text, bars, lines and scatter plots as images, and a one-line pointer to the dashboard for the rest.
- The copy carries at most 12 chart images, and 3 MB of images in all. A chart past either limit becomes the one-line pointer.
- A table in the copy shows its first 8 rows. The attachments carry every row.
- The whole email, attachments included, has to stay under 10 MB, or it is not delivered. A large dashboard with both files attached can pass that. Drop one attachment, or split the dashboard.
Testing before you save
Send test to me sends the dashboard, with the settings as they stand in the dialog, to your own address only. Recipients are left out, the subject starts with[Test], and nothing needs saving first. The test goes out straight away rather than at the scheduled time, and the dialog confirms with “Test email on its way to you.”
The button works once Enable scheduled export is ticked. It checks the form the same way Save does, so it needs at least one recipient in the list even though none of them receive the test.
What recipients receive
Each send is one email fromnoreply@coverbase.ai, wrapped in the same layout as your team’s notification emails (the Internal (team) layout, see Choosing a layout). Replies go to that no-reply address, so put a contact in your Message if you want questions. From the top, the email holds:
- The heading: your Email Title, or the dashboard’s name.
- Your Message. Without one, a line such as “Your scheduled export of Strategic Sourcing Overview from Coverbase is attached.”, then the dashboard’s description.
- The copy of the dashboard, chart by chart, if you ticked Include a copy of the dashboard in the email.
- A line naming the attached files.
- An Open dashboard button.
- A closing line: “You are receiving this email because someone in your organization subscribed this address to a recurring dashboard export.”
Changing, pausing and deleting a schedule
All three start from Schedule export on the dashboard’s row.- Change it. Edit anything and click Save. The next send uses the new settings.
- Pause it. Clear Enable scheduled export and click Save. Nothing sends, and every setting is kept for when you tick it again. A paused schedule can be unfinished: it saves without recipients, attachments or a day. Only an address that is not valid blocks saving it.
- Delete it. Click Delete schedule. It takes effect at once, with no confirmation, and the recipients and email copy go with it. The button appears only once a schedule has been saved.
Whose schedule it is
A schedule sends on behalf of the dashboard’s creator, the person in the Created by column on Dashboards, whoever set the schedule up.- The creator’s notification setting. Everyone has a Dashboard scheduled exports switch in the Export group of their notification settings (Account → Notifications, see Who receives what). Turning it off pauses the schedules on every dashboard that person created, for every recipient. It does not stop the email reaching someone who is only a recipient.
- The warning. While the switch is off, the creator sees “Dashboard scheduled exports are turned off in your notification settings, so this schedule will not send.” at the top of the Scheduled Export dialog. Nobody else sees it, so if a schedule has gone quiet, ask the creator to check their setting.
- Radar and Inspect charts are drawn with the creator’s access. If the creator cannot see those modules, those charts say “The data for this chart is not available.” in every email.
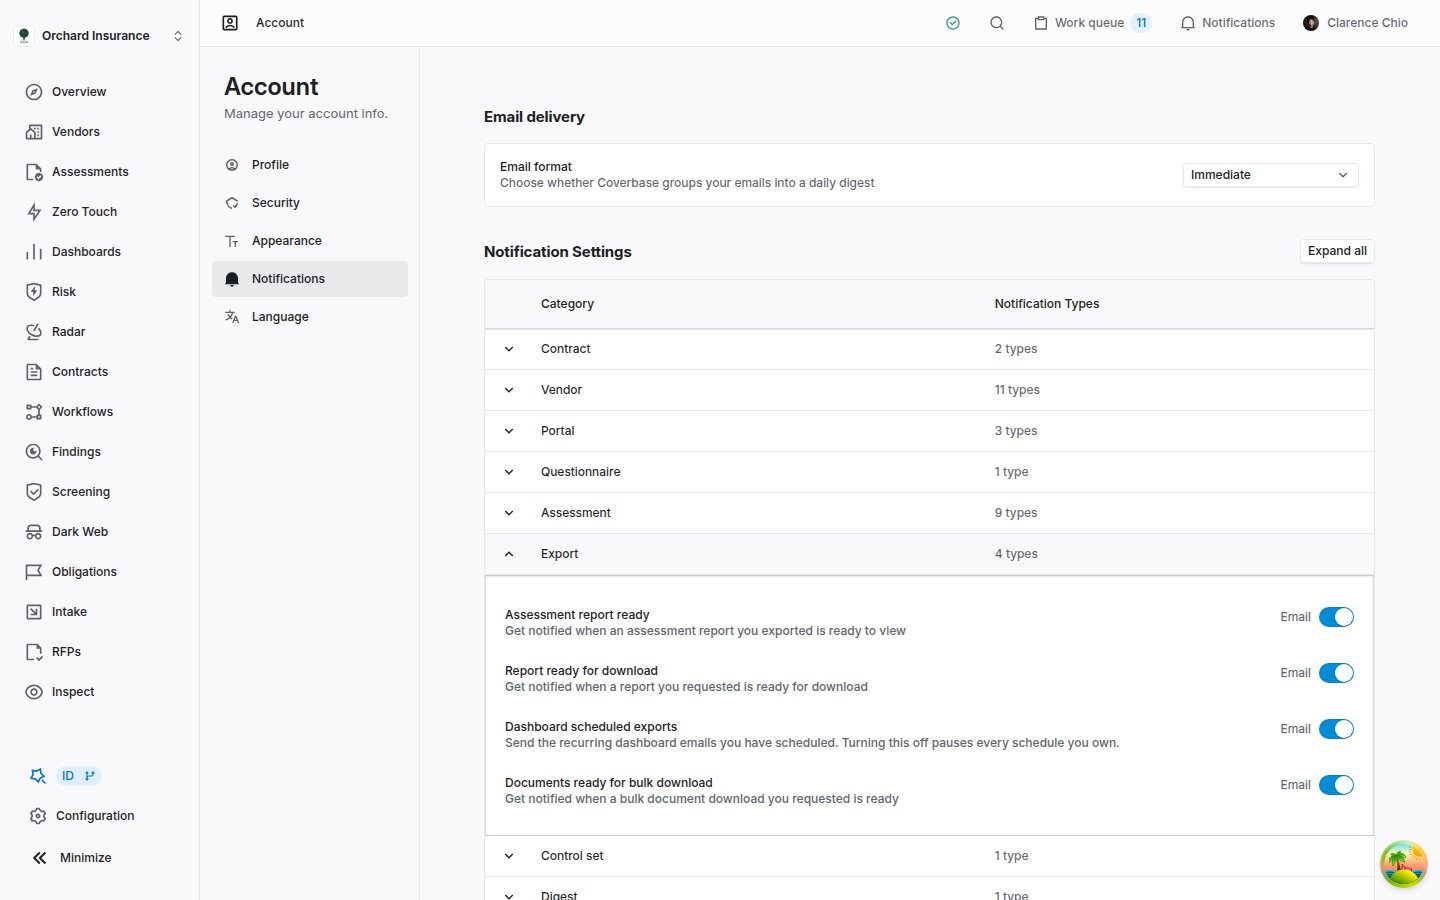
The Export group of the notification settings. Turning off Dashboard scheduled exports pauses every schedule on the dashboards you created.
When someone leaves or loses access
Recipients are addresses, not accounts, so a change to someone’s access changes nothing about a schedule.- A recipient leaves or loses their Coverbase account. They keep receiving every send, attachments and the copy of the dashboard included, until someone removes their address from the schedule. The Open dashboard button stops working for them, but the data still arrives.
- The dashboard’s creator leaves. The schedule keeps sending. Any Radar or Inspect charts on it switch to “The data for this chart is not available.” because the send can no longer draw on the creator’s access.
Who can do what
Anyone else sees Schedule export grayed out, with “Your user role doesn’t have permissions to do this.” when they point at it. Any Admin can change or delete any dashboard’s schedule, including one someone else set up.
Limits
Troubleshooting
Related
Dashboards and the chart library
The ready-made dashboards and charts, and how to put them on a dashboard of your own.
Reporting overview
Assessment deliverables: Word templates, PDF and spreadsheet exports, and the due-diligence file.
Email and notifications
The layout the scheduled email uses, and where your own notification settings live.
Permissions and roles
Who can edit dashboards and their schedules.